

COVID-19 Interest Group
May 19, 2020
Arlin‘s Corner #6
This issue of Arlin’s Corner is meant to provide some background data and analysis of Covid19 mortality rates
First, a disclaimer: The data and information discussed is based on public data. The mathematical analysis and interpretation, discussion and resulting opinions are mine (or my guest Eva Gero's) and have not been reviewed or endorsed by anybody, including CIG & the Berkeley Rotary Club. I am not in the infectious disease or epidemiology fields but bring my experience & expertise in science, mathematics and chemical engineering to these Covid19 issues.
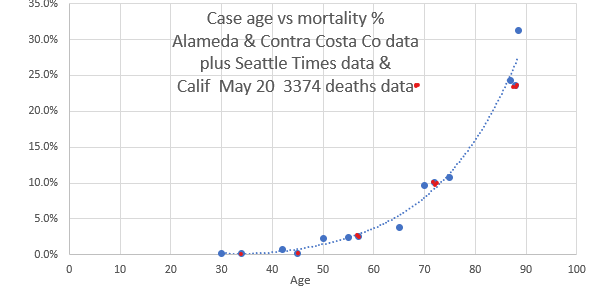
Confirmed Covid-19 Case mortality data by age Arlin Peters
A May 8 email by Eva Gero regarding fatality rates by age groups inspired me to look to see if local data was available to shed some light on this troubling aspect of Covid-19.
Indeed, both the Alameda and Contra Costa Public Health Departments had information on confirmed cases and fatality rates by age group. I think this local data is our best bet to understand our situation as it represents the medical resources, experience and care to be expected if one of our Berkeley Rotary Club members were to be infected with Covid-19.
The A & CC data supports Eva’s May 8 email that 58% of the CDC's 37,308 reported deaths were people over 75. The A&CC data shows 71% of the 96 A&CC deaths were people over 70 - I estimate that means ~62% for people over 75 - very much the same as 58%. There were no deaths for people under 40, compared to CDC's 0.9% for people under 35.
A warning before we proceed: I believe that confirmed cases – cases that were severe enough that the person sought medical care, met the criteria for a PRC test, and was tested with a positive result – represent only a fraction of people with Covid-19. Many people either are asymptomatic and don’t even suspect that they have Covid-19 or have mild/moderate cases such that they don’t seek out medical care and don’t get tested at all.
I believe that total cases may be as much as 10 to 30 times confirmed cases. But age group mortalities are calculated by dividing the age group deaths by the number of age group confirmed cases… not age group total cases. Accordingly, the age group mortalities calculated below may be too high by 10 to 30 times!
But there is a way of looking at the data that is encouraging to me. I calculated the mortality rates for the various age groups of confirmed cases. A&CC have had 2910 confirmed cases and 96 deaths - a fairly low overall mortality rate of 3.3% compared to the US and hard-hit places in the world. For people who had a severe enough case to have sought medical attention, been tested positive and probably hospitalized - the confirmed cases, the fatality rate was: a) 11% for ages 71-80 = 89% survived! b) 24% for ages 81+ = 76% survived! I have also added Seattle Times data supplied by Tina Etcheverry. May 20, added Calif data (in red) from ~84,000 cases with a total of 3374 deaths. Curve looks the same with lots more data
I have converted that data into a rough age - mortality curve, but remember a mortality of 10% may actually be as low as 0.3-1.0 % if total age group cases were used instead of confirmed cases:

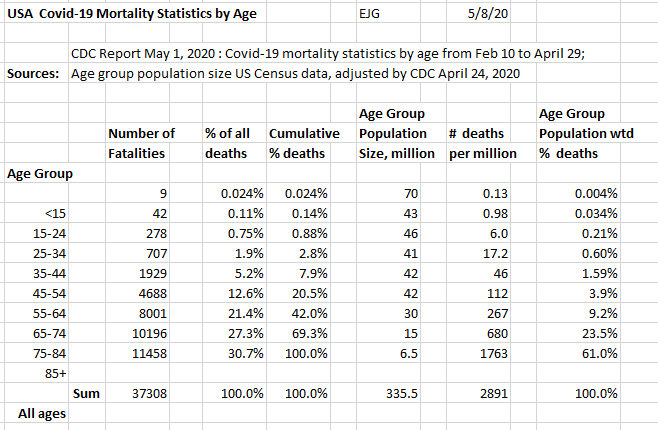
USA CDC Covid-19 Mortality Statistics by Age Eva Gero
The mortality numbers of 9 age groups were provided by CDC's statistics. It indicated the distribution of the fatalities among the 9 age groups within a test cohort of 37,308 cases in US, between February 10 and April 30, 2020. For easier comparison, these numbers were expressed as the percentages of the total cases, marked as "% deaths". It shows how each of the age groups contributed to the total number of mortalities. The various age groups differ in their population sizes, making the comparisons skewed.
To attempt to demonstrate the age-related fatality risk better, the mortality numbers were corrected for the differences in the population size, and expressed as a percentage of the total weighted fatalities. This is marked as "population-weighted % deaths". The results of both calculations indicate that the fatality risk is increasing with age.
The weighted mortality values are best interpreted as comparisons, e.g. at 80 years of age the average fatality risk is 24-fold greater than at age 45, or at age 30 years, the average fatality risk is 5-fold less than at age 45. In practical terms, it means that the older the adult person is, the better protection from infection is needed. People 65 and older should be particularly careful.
On the other hand, fortunately, apart from the rare but severe outcomes under age 30, the 18-30 years old are largely spared from Covid-19.
This analysis did not take into consideration the frequency of special vulnerabilities e.g. that of cardiovascular disease, diabetes, being overweight immunocompromised, etc.
Of particular importance is the proportion of persons in nursing homes with a marked disadvantage in their living conditions (shared, crowded space with an extreme chance for virus spread) combined with the disproportionally frequent occurrence of multiple underlying health problems. Bulking together the nursing home residents with the independently living healthy presents a biased, higher than true risk for the healthy aged. Statistics with better differentiation between these sub-groups will give a more reliable risk assessment.
We may also say that the mortality should be best assessed within the confirmed infected, but these statistics are not available for this cohort.
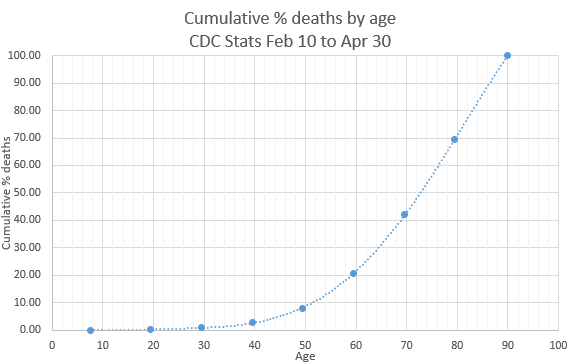
This graph of cumulative deaths by age shows the median death age is 74, half the fatalities were over 74, half younger. Ninety two percent of deaths are people older than 50.

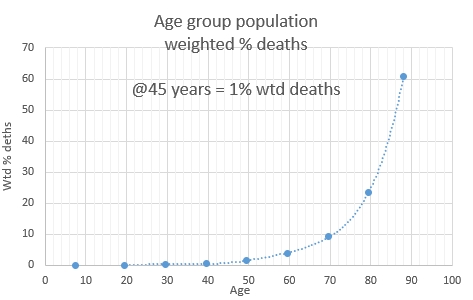
Since not all age groups have the same number of persons, (45-54 has 42 million, 75-84 has 15 million), age group weighted % deaths is a more accurate way for looking at individuals. See the table above. This is best done relatively. Someone 80 years old has 24 times the risk of someone 45 [24/1]. Someone 30 has 20% of the risk of someone 45 [0.2/1].
