
COVID-19 Interest Group
April 28, 2020
Arlin‘s Corner #5
This issue of Arlin’s Corner is meant to provide some background data and analysis of the current Covid19 situation in the GBA and a few other locations - which might shed light on our predicament
To make more sense of this information, it would be useful for you to have read Arlin’s Corner #4 “Three stages of the GBA Covid19 epidemic.” It’s in the Covid19 Info Tab of the BerkeleyRotary.org public website.
First, a disclaimer: The data and information discussed is based on public data. The mathematical analysis and interpretation, discussion and resulting opinions are mine alone and have not been reviewed or endorsed by anybody, including CIG & the Berkeley Rotary Club. I am not in the infectious disease or epidemiology fields but bring my experience & expertise in science, mathematics and chemical engineering to these Covid19 issues.
The information below is based on confirmed case Covid19 data thru April 26 for the GBA, Contra Costa, and Alameda and Contra Costa Counties combined. I believe the A&CC data best represents the situation in the East Bay. From the number of daily new confirmed cases, the cumulative number of confirmed cases and the number of cumulative deaths -- the percent of the population infected, mortality percent and trend of new cases can be estimated. The data suggests that our area has passed the peak of new Covid19 infections during the 1st week of April, and is now in Stage’s III & IV – Plateau & Decreasing Daily Growth
There is however, a big elephant in the room – that’s if the number of confirmed cases really is representative of the actual number of Covid19 cases. And for all the time since early in March, the only data we’ve had is “confirmed cases.” It’s been clear that from March 16th on, that actual cases might be as much as 7 times the confirmed cases.
If we just work from “confirmed cases” - cases where the Covid19 symptoms an infected person had were so severe that they sought out medical care, then met the medical or exposure criteria for being tested by PCR and finally had a positive test result, which was then reported as a “confirmed case.” These are the Covid19 numbers you see and read about in the media for the GBA, California, New York, the US and indeed the whole world.
Looking at these confirmed case numbers, one concludes that Covid19 is a relatively rare but very deadly virus. For the US by April 26, 966,000 people had Covid 19 (0.29%), and about 55,000 have died - the mortality rate is 5.7%. Covid19 is thought to be very contagious, but has only infected a small percentage of people compared to the flu. For example, in the US 2018-2019 flu season, 34 million people had the flu (10% of the population) and 34,000 people died – a 0.1% mortality rate. It looks like Covid 19 was 57 times worse than the flu, but less contagious.
It is my opinion that the number of actual Covid19 cases is probably 10-30 times (or more) than the number of confirmed cases. This multiplying factor seems to depend on the confirmed case infection % in a given location. The factor is highest, 30 times or more, when the local infection confirmed rate is low 0.06-0.1% (as in Santa Clara or LA) counties. The factor is lowest, 12 times, when the local infection is higher, 1.75% (as in NYC).
The evidence for my 10-30 factor is too long and complicated to be discussed here. But just yesterday, in the East Bay Sunday Times, there is an article about 3,277 prison inmates who tested positive for the virus. The vast majority, 96%, were asymptomatic – no symptoms when tested. The multiplying factor for this group is 100%/4% = 25. If anybody is interested in more detail I can provide what I have used to estimate the 10-30 factor.
The 10-30 times multiplying factor has a dramatic effect on: a) the estimated population % who have had Covid19; b) the mortality rate; c) the daily number of new cases; d) the daily risk of interacting with somebody who currently is contagious and probably doesn’t know it; e) the hospitalization rate of Covid19 infected people; f) the ability to do contact tracing in order to slow the spread of Covid19; and g) even things like the length of time it will take Californians to reach 70% infected and herd immunity.
A side note: California has a population of 40 million people, so herd immunity is thought to be reached when 70% - 28 million people have had Covid 19. Recently, the daily number of California new Covid19 cases is about 1,800 per day. If this rate continues over a very long period of time, it will take 43 years to reach 28 million. If the multiplying factor is 20, this reduces to a still lengthy 2 years.
COVID19 DATA TABLE
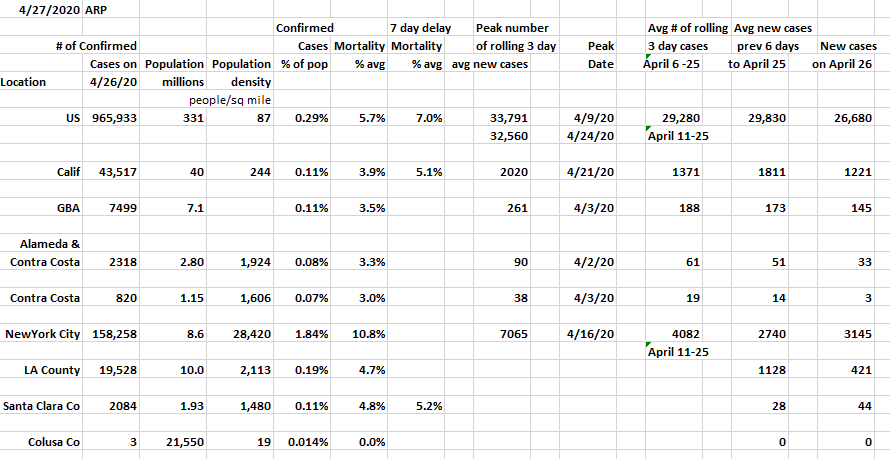
The table above shows Covid19 data through April 26 for the Bay Area and Bay area counties, plus LA, California, New York City and the US. In the GBA, and Alameda & Contra Costa counties, the Covid19 peak of daily new cases was reached on April 2nd and 3rd. Since then, the number of daily new cases has been steadily but slowly declining. Unless things change, we are in Stage IV, Decreasing Daily Growth.
The GBA had 7499 cases on April 26, 0.11% of its 7.1 million residents, mortality at 3.5%. New cases peaked at 261 on April 3rd and have been slowly but steadily decreasing. On Sunday, there were 145 new cases, compared to an average of 173 over the previous 6 days. Daily new cases have been decreasing at about 2.5 per day since the peak.
Sunday in the East Bay, represented by Alameda and Contra Costa counties combined, there were 2318 cumulative confirmed cases, about 0.08% of the 2.8 million residents. Mortality was 3.3%. There were 145 new cases Sunday, down from the peak of 261 new cases, and less than the 188 average new cases since the peak. Contra Costa county had only 3 new cases on Sunday, down from 90 peak, in a population of 1.1 million!
Of course, I believe there is a factor of 10-30 from confirmed to actual cases to be applied….maybe 0.8 to 2.5% of the A&CC population has been infected but mortality is reduced to 0.1 to 0.3%, worse than the flu but not far worse.
California’s situation is in some ways similar to GBA: Confirmed cases are also 0.11% of its 40 million and mortality is 3.9%. California had a peak of ~1330 new cases on April 4, and for two weeks new cases were between 1000 and 1200. But instead of slowly and steadily declining, new cases rapidly increased to a new peak of 2020 on April 21. Since then new cases have declined back down to a 1415 rolling 3 day avg on April 25th. There were 1221 new cases on April 26.
LA County has 18,517 cases, 0.18% of its 10 million population and a mortality of 4.6%. LA has 25% of the state’s population but 45% of the cases! It appears that a spike of Covid19 cases in LA County was responsible for the recent California peak. In the 5 days from April 19 to April 24, statewide cases increased by 9585 cases – and LA County, with 25% of Calif population, added 6176 of them – about 2/3rds of the total. Increasingly what happens in Southern California will determine the direction of Covid19 in California.
On April 26, the US had about 966,000 cases, 0.29% of the population and a mortality rate of 5.7%. Like California, the US has had two new case peaks – 33,790 on April 9 and 32,560 on April 24th. The daily number of new cases has been between 27,000 and 32,000 since April 9th, averaging about 29,500. The US appears to be in a plateau Stage III, and it’s hard to know whether it’s up or down from.
New York City has 158,000 cases as of April 26, 1.84% of its population and a high 10.8% confirmed case mortality. It has had between 5,000 and 6,000 new cases per day from April 8 to the 15th, peaking at 7,000 on April 16th, then falling quickly to 2,000 to 3,000 recently. There were 3,145 new cases on April 26. Hopefully the worst is over for New York City, but it has been one of the hot spots in the US and maybe the world.