

COVID-19 Interest Group
April 20, 2020
Arlin‘s Corner #4 April 20, 2020
The data, information and estimation of future cases presented below is based on public data and my own personal mathematical analysis of it. It has not been peer reviewed and has not been officially endorsed by the Berkeley Rotary Club. It is a brief summary concentrating on today's Covid19 situation in the Greater Bay Area and Alameda & Contra Costa Counties. If you have any questions, please call me at 510-501-0298. If you are interested in a copy of my Excel spreadsheet for the analysis of GBA or A&CC data, please e-mail me at arcapeters@comcast.net......Arlin Peters
===============================================================================================
THREE STAGES OF THE GBA COVID19 EPIDEMIC
ANALYSIS OF GBA COVID19 CASE DATA FROM MARCH 9TH THRU APRIL 16
Arlin Peters Published by e-mail April 18, 2020
On April 16, the GBA had 155 new cases, bringing the cumulative confirmed cases to 5,811, at 818 cpm. Overall reported mortality has been about 3.2%. Over the previous 6 days, the number of daily new cases has been fairly flat and averaged 204.
Using the Stanford Medical Dept factor of 50 (based on Santa Clara antibody testing) to go from reported confirmed cases to actual cases, I estimate that on April 16, 5% of the GBA population had been infected with Covid 19 and the mortality was about 0.1% (using Santa Clara’s 4.8% confirmed case mortality rate).
This is about the same death rate as during the 2018-2019 US flu season, however only 10% of the US got infected with the flu. With Covid 19, up to 70% could be infected, so the total number of deaths could be 7x the flu. In addition, the Covid 19 reported mortality rate varies widely over many locations and nations – from 3% to as high as 13%. The 0.1% estimate based on Santa Clara’s 4.8% mortality would have been 0.3% using a 13% mortality rate, a factor of 3 higher. More work is needed to understand why mortality rates vary so much. Underlined material added April 20.
Looking back over the GBA growth of Covid19 since March 9, I believe there has been three different stages, and anticipate a fourth:
- Stage I - Introduction of the virus and subsequent Unconstrained Exponential Growth;
- Stage II – Constrained Exponential Growth (constrained by government policy - business closures, shelter in place, masks and social distancing, etc) leading (eventually) to a peak of daily new cases;
- Stage III - Plateau Linear Growth – after the peak of new cases, a period of fairly constant daily new cases. We are currently in Stage III, looking forward to:
- Stage IV – Declining Growth, where the number of daily new cases trends down toward a low number.
==========================================================
One important caveat about this Covid case analysis – it is based only on confirmed Covid19 cases. These are cases with severe enough symptoms that the infected person has sought medical advice and/or testing and has had a positive result. There are many infected people with asymptomatic, mild and even moderate symptoms who have not done this and are not counted as confirmed. We have no good understanding of how many of these infected but “unconfirmed” cases there are. Understanding will not occur until widespread random Covid19 blood antibody testing is done. (PS as this was written, the first such study was published, see below.)
The little information that can be scavenged from published information is that actual cases are: a) 2-3 times the confirmed (Iceland testing); b) Anecdotal information that 80% of cases are mild and 20% are severe enough to require hospitalization, for a factor of 5; c) A Chinese modeling study found 7 times; d) A US study on recent “excess” cases of people seeking flu medical attention estimated a factor of up to 150. Studies of the number of all Covid cases is a limited area have ranged from 0.8%, 2%, 2.7%, 3% to 10 to 15% of the population and even 17% on a cruise liner.
As this was being written on April 17, the Stanford University Department of Medicine released a preprint of quasi–random Covid antibody blood testing of 3,330 Santa Clara County residents on April 3&4. Their conclusion was that the number infected (having antibodies to CoV-2) was 50 to 80 times the number of Santa Clara County reported confirmed Covid19 cases on April 4. The analysis below uses the reported confirmed cases. When estimating the % of GBA residents who have Covid19 and the % mortality, I use 50 times the reported confirmed cases to get actual cases.
=============================================================
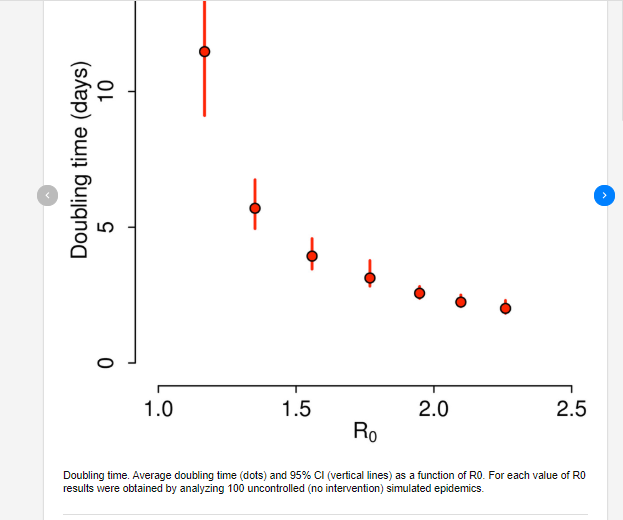
My data and analysis begins on about March 9th. Covid19 has been introduced into the GBA by travelers mainly from China. Soon it began to spread, undetected and unconstrained, by community transmission. It is thought that during this unconstrained growth a contagious person will infect about 2.5 other people (The Covid19 range is listed in Wikipedia as 1.4-5.7 depending on how many and how close the contacts are between the infected person and others on the average).
This “basic reproduction number” is called R0. For R0 larger than 1, there is exponential growth. The larger R0 is, the faster the growth and the smaller the DT. At R0=1, an infected person infects one other person, and the growth is linear. At R0 less than 1, the infection dies out, slowly for R0 close to 1 and quickly for R0 close to zero..
In exponential growth, a key number is the doubling time (DT) the number of days it takes for the cumulative number of cases to double. A DT of 2 days leads to rapid growth, because in 8 days [four doubling periods (8/2=4)] the number of cases goes from 1 to 2, 2 to 4, 4 to 8, and finally from 8 to 16 times!
Stage I – Unconstrained Exponential Growth
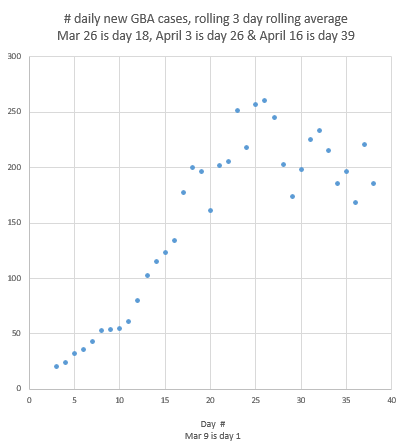
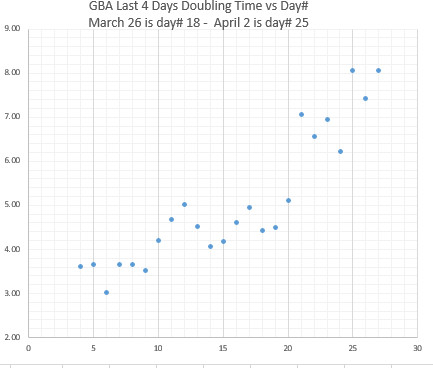
On March 9 there were 80 GBA cases. By March 26th, 15 days later there were 1418 cases. The number of new cases per day had grown from about 20 to 200. The doubling time (DT) during this period was fairly constant at ~4 days, but trending up from 3.6 initially to 4.6 at the end.
On March 17, the GBA began serious government ordered sheltering in place and business closures. Covid 19 transmission began being constrained. Some degree of local and personal constraint had been occurring as early as March 9.
Stage II – Constrained Exponential Growth
It appears there was a lag time of about 6-10 days after March17, before the rolling 4 day average DT began increasing around March 26. This was the indication that Stage II had begun. This is consistent with the assumption that it takes about 7 days from initial infection to develop a severe enough Covid 19 case to have sought medical attention and be tested and found to be positive and reported as a confirmed case.
During the 8 days from March 27 to April 3, the number of daily new cases rose from 200 to a peak of 261 (as measured by the rolling 3 day average). On April 3rd, the cumulative number of confirmed cases reached 3151. During this time DT increased from 4.4 to about 8. It appears that from March 17 on to April 3, the rate of infection R0 was reduced towards 1.
Stage III – Plateau Linear Growth
After April 3, the number of daily new cases decreased for a few days, then leveled off, fluctuating at about 200 +/- 50. By April 16, this linear growth had raised the cumulative number of confirmed cases to 5811. During linear growth, logarithmic DT can be calculated but has no real meaning. The real doubling is the time at 200 daily new cases to add another 5811 cases or 29 days. The R0 is about 1….if it was higher than 1, the number of daily new cases would grow…if it was lower than, the number of daily new cases would shrink.
At this point, GBA has been in this plateau linear growth stage for 2 weeks. We do not know if GBA cases will resume growing (if transmission rates increase by less strict behavior) or will begin decreasing (when transmission rates decrease by more strict behavior).
Stage IV – Decreasing Daily Growth
If this happens GBA will enter Stage IV, decreasing growth, as the number of cumulative confirmed cases levels off. We will see this happen if the average number new cases reduces to below 150 or so.